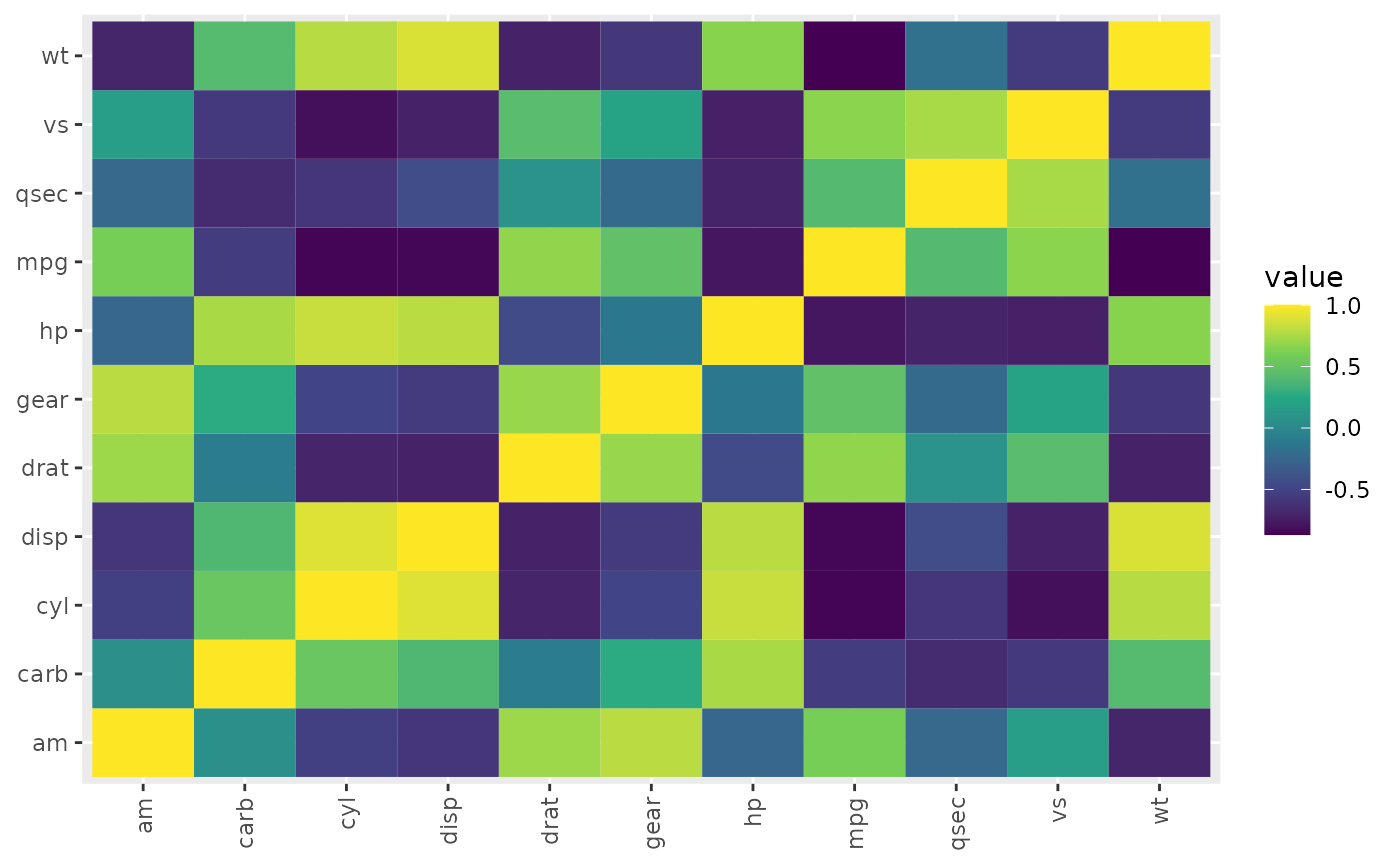
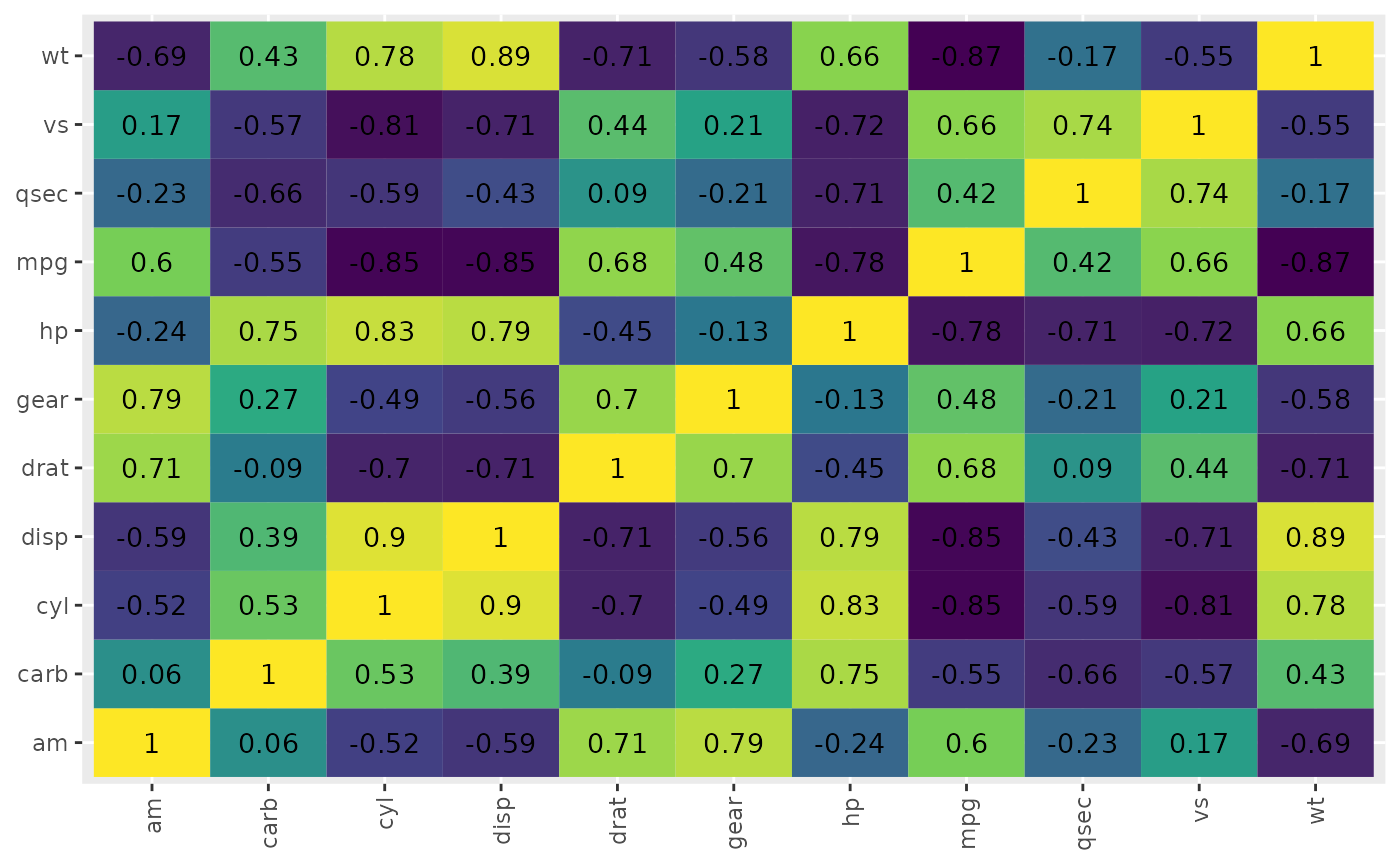
See the measure of correlation between each column in a data frame
Source:R/default_plots.R
correlation_plot.RdCreate a heatmap of the correlation matrix of a data frame, created using
cor().
Arguments
- data
The data to plot
- show_text
Whether to show the correlation number over each panel in the heatmap.
Value
A ggplot2::ggplot() object.