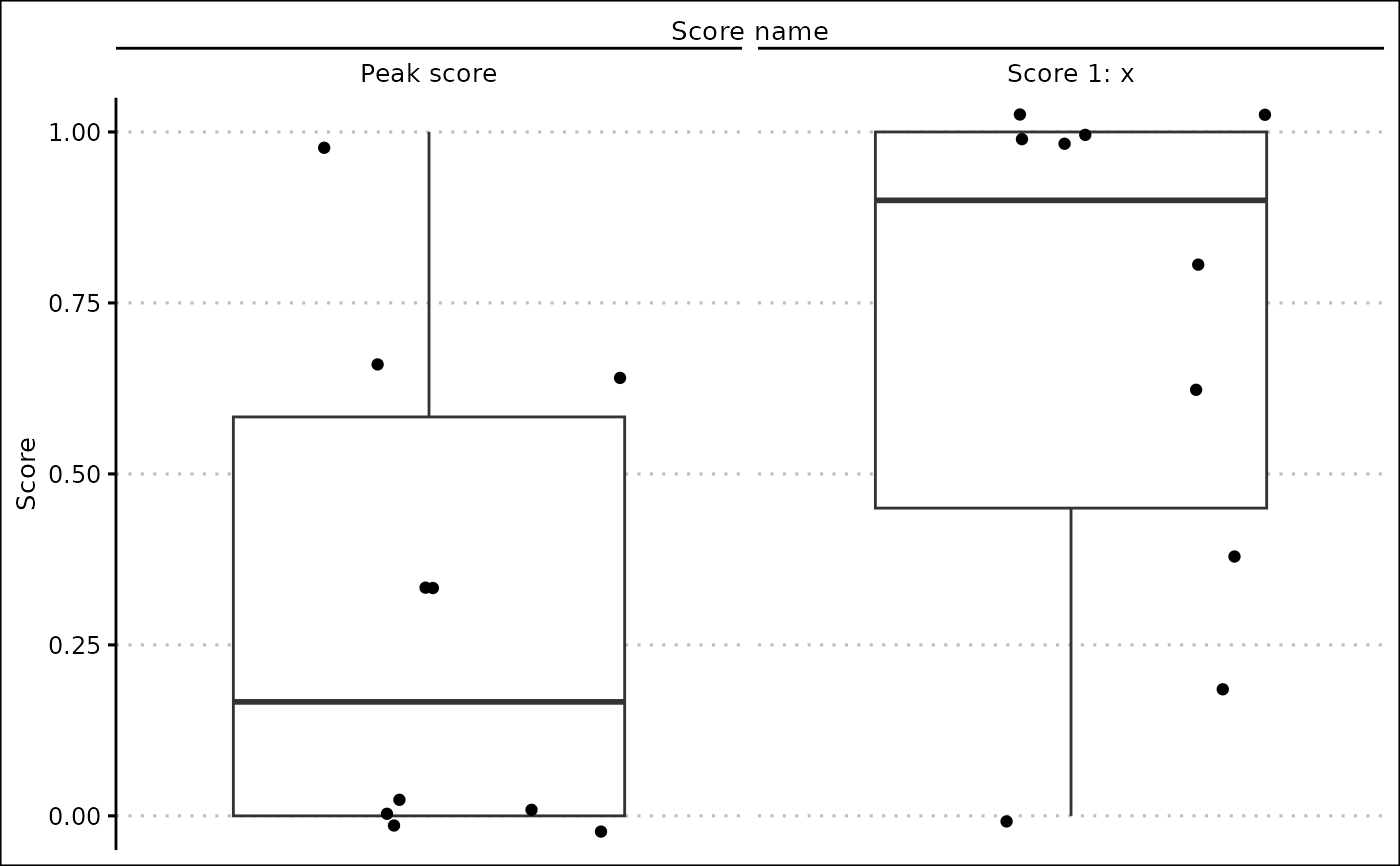
Use a boxplot and jitter plot to display the spread and arrangement of a set of scores. Can often be used to view non-useful scores, where the majority of the scores are the same.
Arguments
- scores
A data frame containing a set of numerical scores. If your data frame has been scored using
apply_scores(), useget_scores()to extract the actual scores.
Value
A ggplot2::ggplot() object.
Examples
data <- tibble::tibble(
  x = 1:10
)

scores <- create_score(
  scores_init,
  score_type = "Linear", colname = "x", score_name = "Default",
  weight = 1, lb = 1, ub = 6, exponential = FALSE
)
scores <- create_score(
  scores,
  score_type = "Peak", colname = "x", score_name = "Peak score",
  weight = 2, lb = 2, ub = 8, centre = 5, inverse = FALSE,
  exponential = FALSE
)

scored <- apply_scores(data, scores)
score_distributions(get_scores(scored, scores, final_score = FALSE))