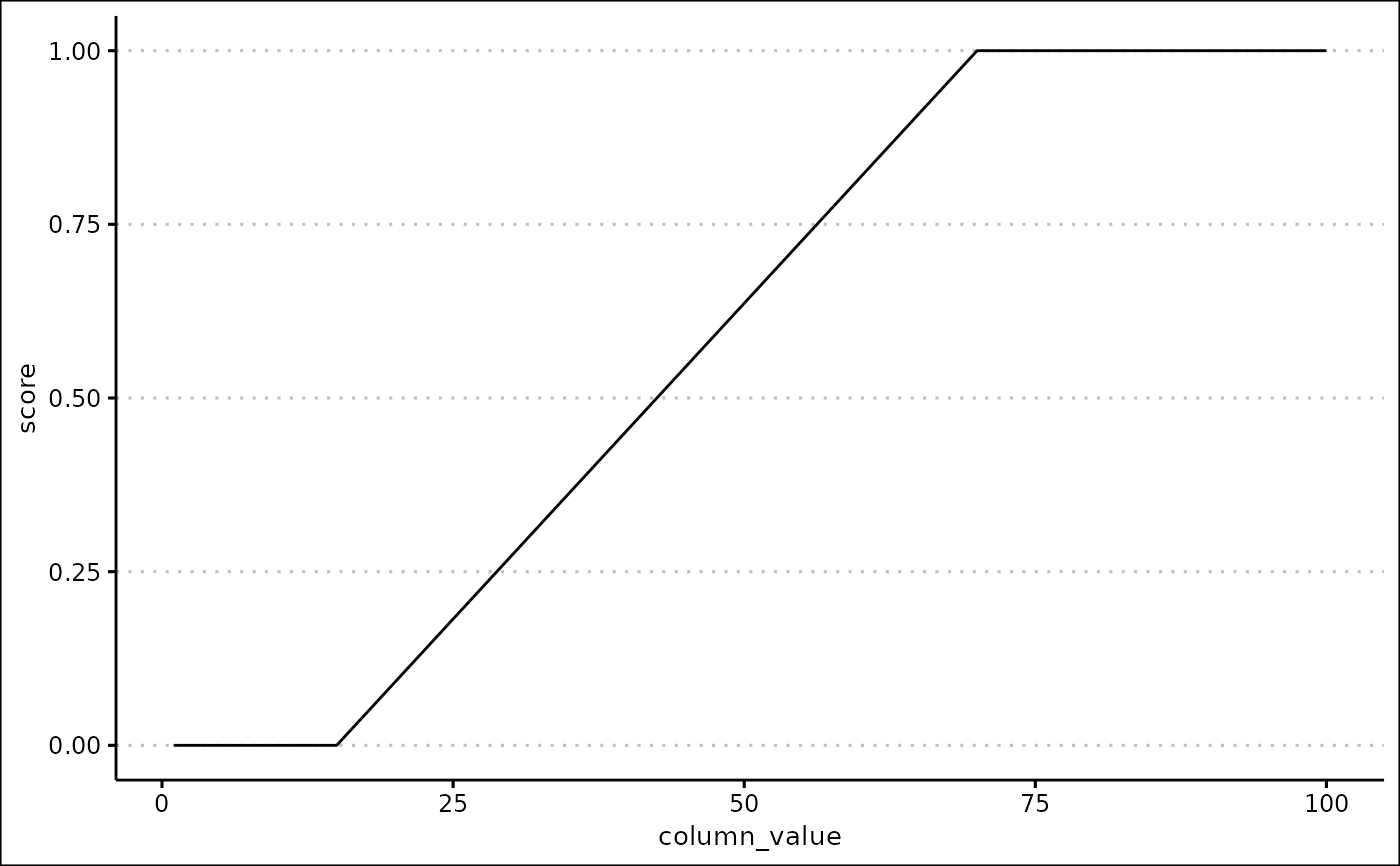
Generate a summary of a score currently being created. Generates a line graph comparing the column value and the corresponding score.
Arguments
- x
The column being scored.
- ...
The score arguments. See
create_score().
Value
A ggplot2::ggplot() object containing the graph.