This method calls parsnip::autoplot.model_fit() on each model fitted on
each nested data frame, returning a list of plots.
Usage
# S3 method for nested_model_fit
autoplot(object, ...)
Arguments
- object
A
nested_model_fitobject produced byfit.nested_model().- ...
Passed into
parsnip::autoplot.model_fit().
Value
A list of ggplot2::ggplot() objects.
Details
Printing the list of plots will print every plot in turn, so remember to store the result of this function in a variable to look at each plot individually.
Examples
library(dplyr)
library(tidyr)
library(purrr)
library(parsnip)
library(glmnet)
#> Loading required package: Matrix
#>
#> Attaching package: ‘Matrix’
#> The following objects are masked from ‘package:tidyr’:
#>
#> expand, pack, unpack
#> Loaded glmnet 4.1-8
library(ggplot2)
data <- filter(example_nested_data, id %in% 16:20)
nested_data <- nest(data, data = -id2)
model <- linear_reg(penalty = 1) %>%
set_engine("glmnet") %>%
nested()
fit <- fit(model, z ~ x + y + a + b, nested_data)
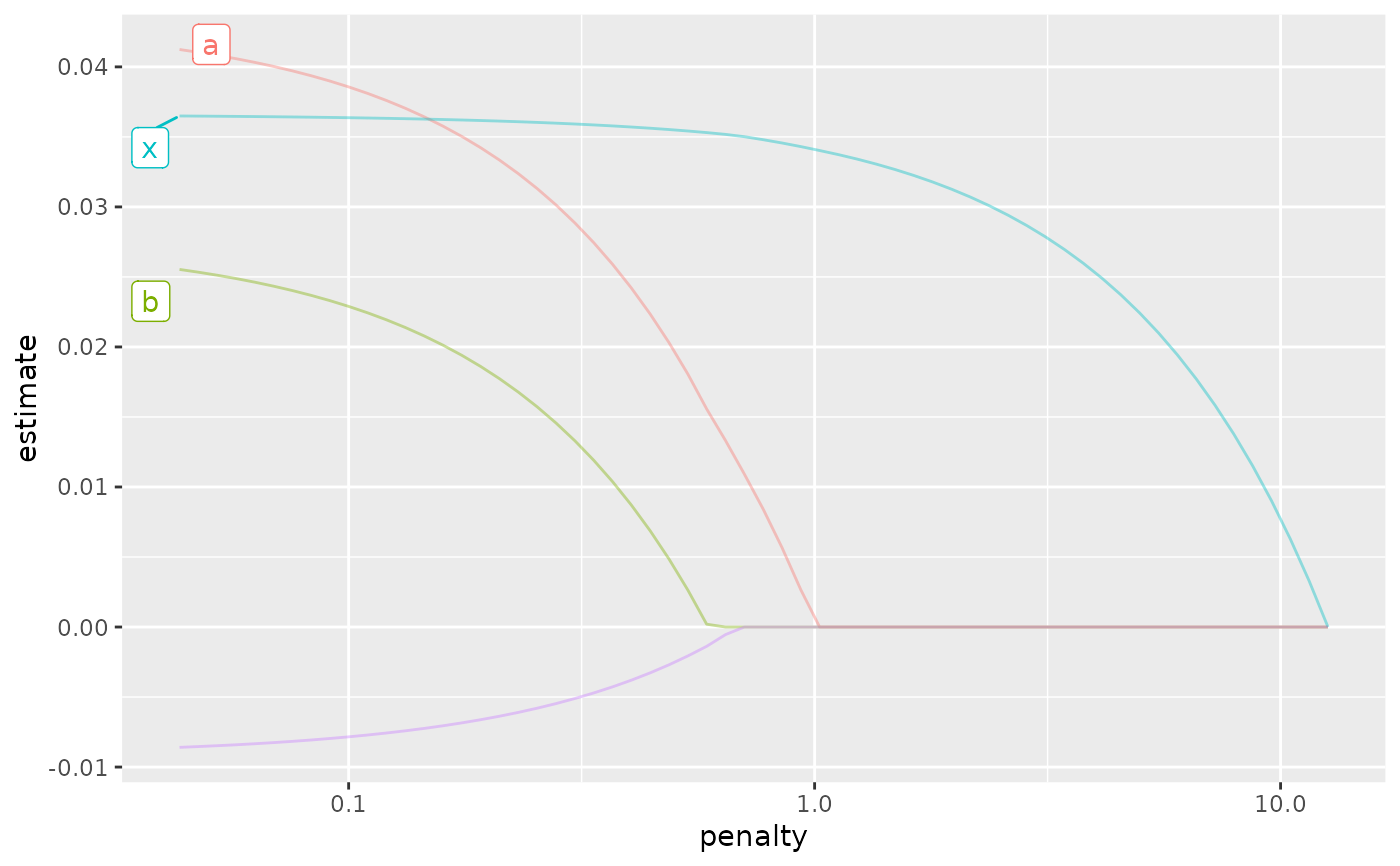
plots <- autoplot(fit)
# View the first plot
plots[[1]]
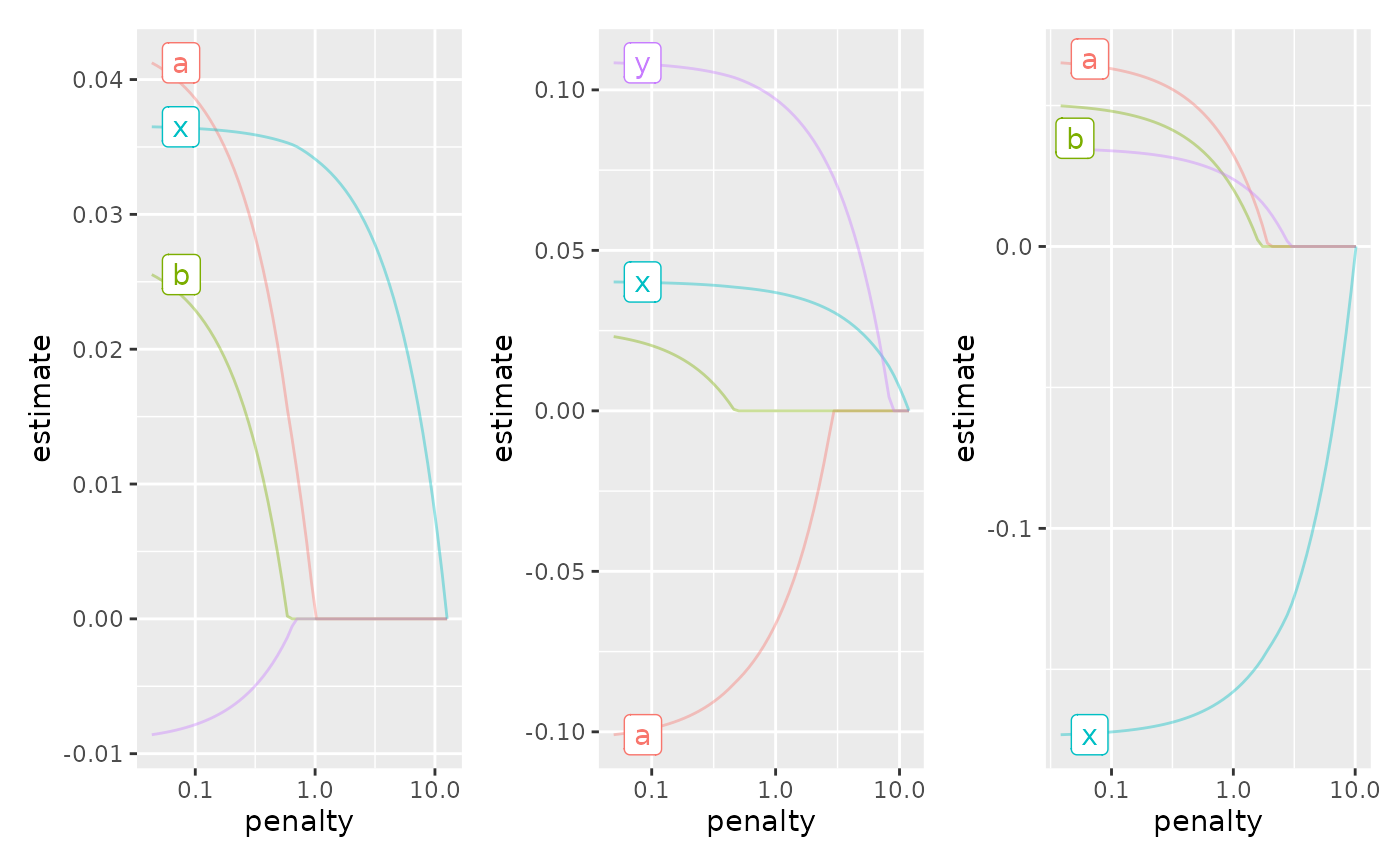
 # Use the patchwork package (or others) to combine the plots
library(patchwork)
reduce(plots, `+`)
# Use the patchwork package (or others) to combine the plots
library(patchwork)
reduce(plots, `+`)